
"Body build: its development and inheritance," by C.B. Davenport, Eugenic Record Office (3)
"Body build: its development and inheritance," by C.B. Davenport, Eugenic Record Office (3)
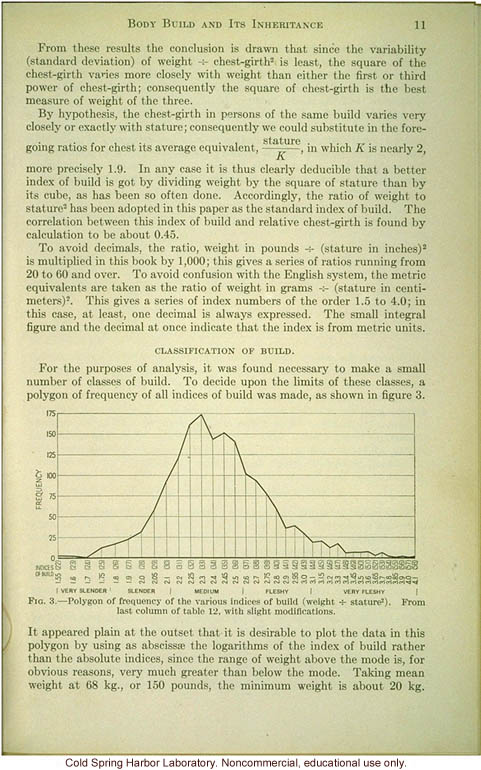
606. Body Build and Its Inheritance 11 From these results the conclusion is drawn that since the variability (standard deviation) of weight [division symbol] chest-girth[superior]2[end superior] is least, the square of the chest-girth varies more closely with weight than either the first or third power of chest-girth; consequently the square of chest-girth is the best measure of the weight of the three. By hypothesis, the chest-girth in persons of the same build varies very closely or exactly with stature; consequently we could substitute in the foregoing ratio for chest its average equivalent, stature/K, in which K is nearly 2, more precisely 1.9. In any case it is thus clearly deducible that a better index of build is got by dividing weight by the square of stature than by its cube, as has been so often done. Accordingly, the ratio of weight to stature[superior]2[end superior] has been adopted in this paper as the standard index of build. The correlation between this index of build and relative chest-girth is found by calculation to be about 0.45. To avoid decimals, the ratio, weight in pounds [dividing symbol] (stature in inches)[superior]2[end superior] is multiplied in this book by 1,000; this gives a series of ratios running from 20 to 60 and over. To avoid confusion with the English system, the metric equivalents are taken as the ratio of weight in grams [dividing symbol] (stature in centimeters)[superior]2[end superior]. This gives a series of index numbers of the order 1.5 to 4.0; in this case at least, one decimal is always expressed. The small integral figure and the decimal at once indicate that the index is from metric units. Classification of Build. For the purposes of analysis, it was found necessary to make a small number of classes of build. To decide upon the limits of these classes, a polygon of frequency of all indices of build was made, as shown in figure 3. [figure graph] Fig. 3. - Polygon of frequency of the various indices of build (weight [dividing symbol] stature[superior] 2[end superior]). From last column of table 12, with slight modifications. It appeared plain at the outset that it is desirable to plot the data in this polygon by using as abscisse the logarithms of the index of build rather than the absolute indices, since the range of weight above the mode is for obvious reasons, very much greater than below the mode. Taking mean weight at 68 kg., or 150 pounds, the minimum weight is about 20 kg.
- ID: 10593
- Source: DNALC.EA